CALL US TODAY: (870) 425-4300

With the housing crash of 2006-2008 still visible in the rear-view mirror, many are concerned the current correction in the stock market is a sign that home values are also about to tumble. What’s taking place today, however, is nothing like what happened the last time. The S&P 500 did fall by over fifty percent from October 2007 to March 2009, and home values did depreciate in 2007, 2008, and 2009 – but that was because that economic slowdown was mainly caused by a collapsing real estate market and a meltdown in the mortgage market.
This time, the stock market correction is being caused by an outside event (the coronavirus) with no connection to the housing industry. Many experts are saying the current situation is much more reminiscent of the challenges we had when the dot.com crash was immediately followed by 9/11. As an example, David Rosenberg, Chief Economist with Gluskin Sheff + Associates Inc., recently explained:
“What 9/11 has in common with what is happening today is that this shock has also generated fear, angst and anxiety among the general public. People avoided crowds then as they believed another terrorist attack was coming and are acting the same today to avoid getting sick. The same parts of the economy are under pressure ─ airlines, leisure, hospitality, restaurants, entertainment ─ consumer discretionary services in general.”
Since the current situation resembles the stock market correction in the early 2000s, let’s review what happened to home values during that time.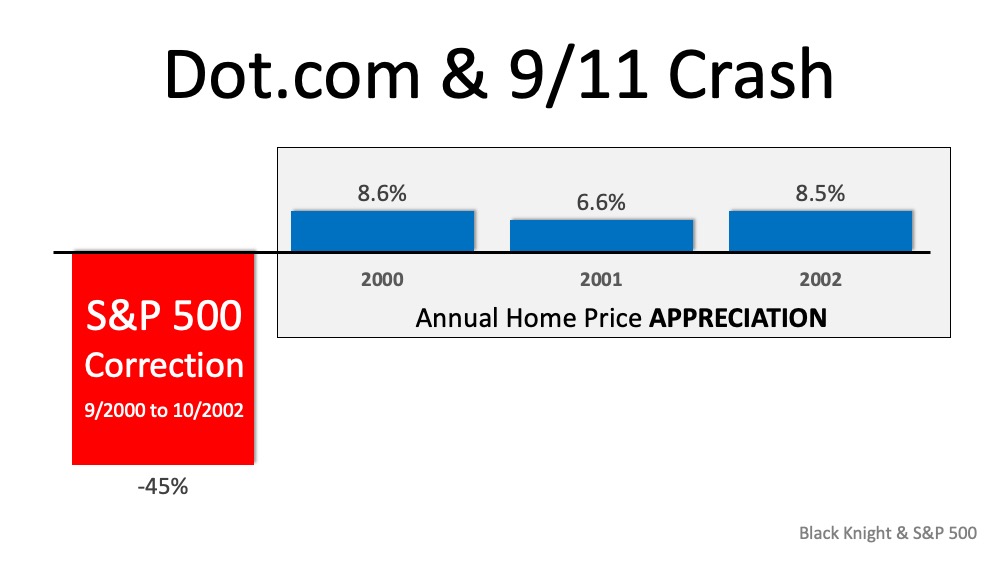 The S&P dropped 45% between September 2000 and October 2002. Home prices, on the other hand, appreciated nicely at the same time. That stock market correction proved not to have any negative impact on home values.
If the current situation is more like the markets in the early 2000s versus the markets during the Great Recession, home values should be minimally affected, if at all.

With all of the volatility in the stock market and uncertainty about the Coronavirus (COVID-19), some are concerned we may be headed for another housing crash like the one we experienced from 2006-2008. The feeling is understandable. Ali Wolf, Director of Economic Research at the real estate consulting firm Meyers Research, addressed this point in a recent interview:
“With people having PTSD from the last time, they’re still afraid of buying at the wrong time.”
There are many reasons, however, indicating this real estate market is nothing like 2008. Here are five visuals to show the dramatic differences.
During the housing bubble, it was difficult NOT to get a mortgage. Today, it is tough to qualify. The Mortgage Bankers’ Association releases a Mortgage Credit Availability Index which is “a summary measure which indicates the availability of mortgage credit at a point in time.” The higher the index, the easier it is to get a mortgage. As shown below, during the housing bubble, the index skyrocketed. Currently, the index shows how getting a mortgage is even more difficult than it was before the bubble.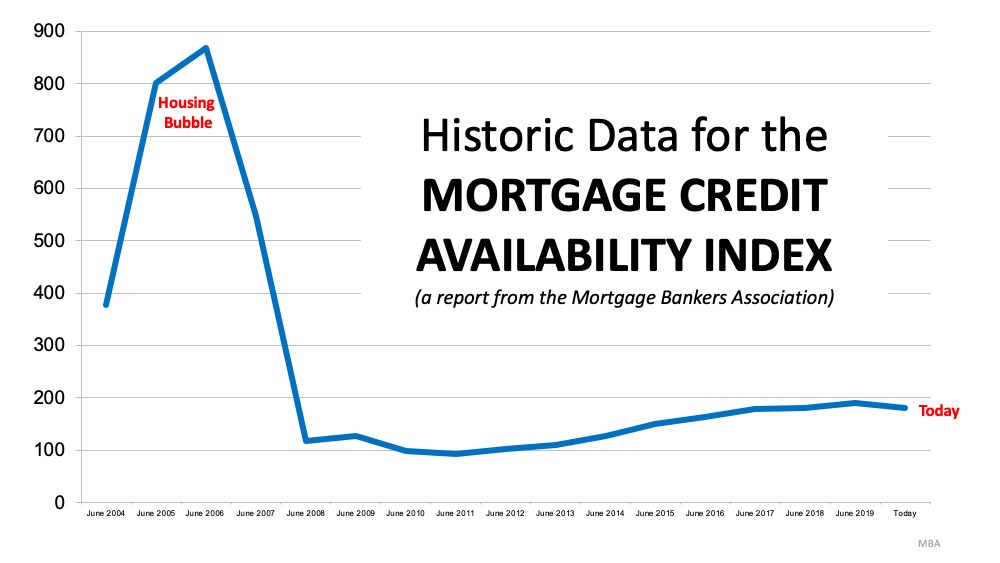
Below is a graph showing annual house appreciation over the past six years, compared to the six years leading up to the height of the housing bubble. Though price appreciation has been quite strong recently, it is nowhere near the rise in prices that preceded the crash.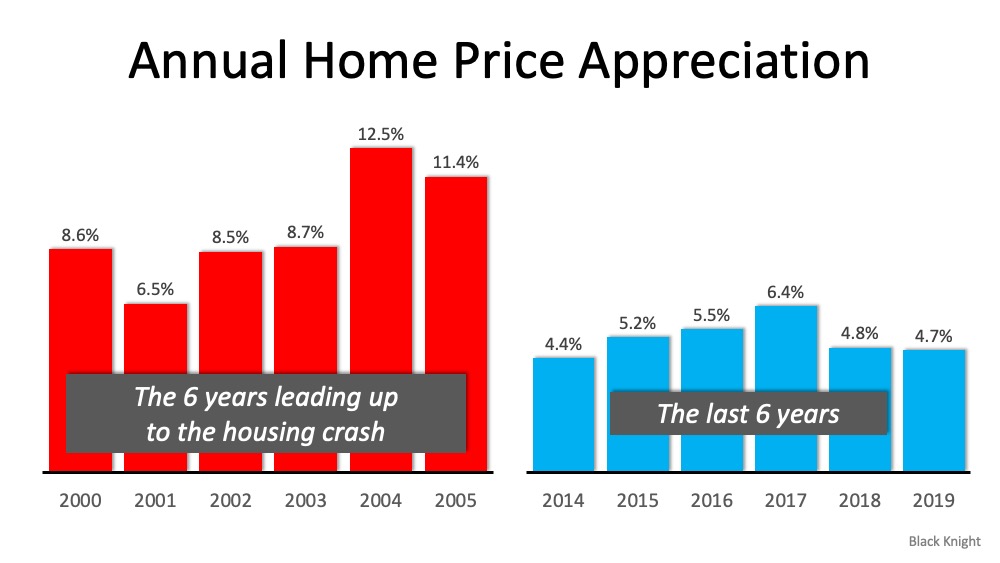 There’s a stark difference between these two periods of time. Normal appreciation is 3.6%, so while current appreciation is higher than the historic norm, it’s certainly not accelerating beyond control as it did in the early 2000s.
The months’ supply of inventory needed to sustain a normal real estate market is approximately six months. Anything more than that is an overabundance and will causes prices to depreciate. Anything less than that is a shortage and will lead to continued appreciation. As the next graph shows, there were too many homes for sale in 2007, and that caused prices to tumble. Today, there’s a shortage of inventory which is causing an acceleration in home values.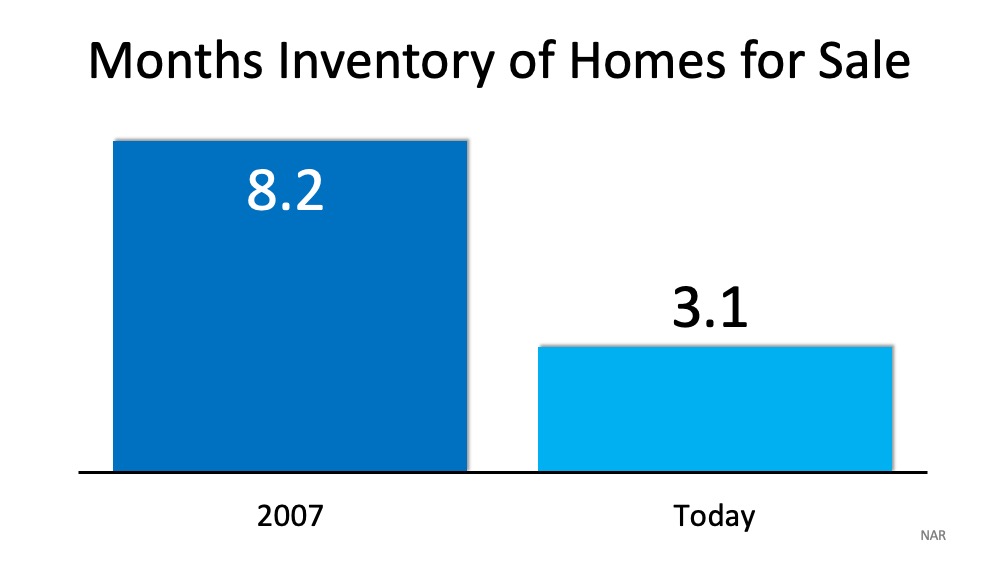
The affordability formula has three components: the price of the home, the wages earned by the purchaser, and the mortgage rate available at the time. Fourteen years ago, prices were high, wages were low, and mortgage rates were over 6%. Today, prices are still high. Wages, however, have increased and the mortgage rate is about 3.5%. That means the average family pays less of their monthly income toward their mortgage payment than they did back then. Here’s a graph showing that difference: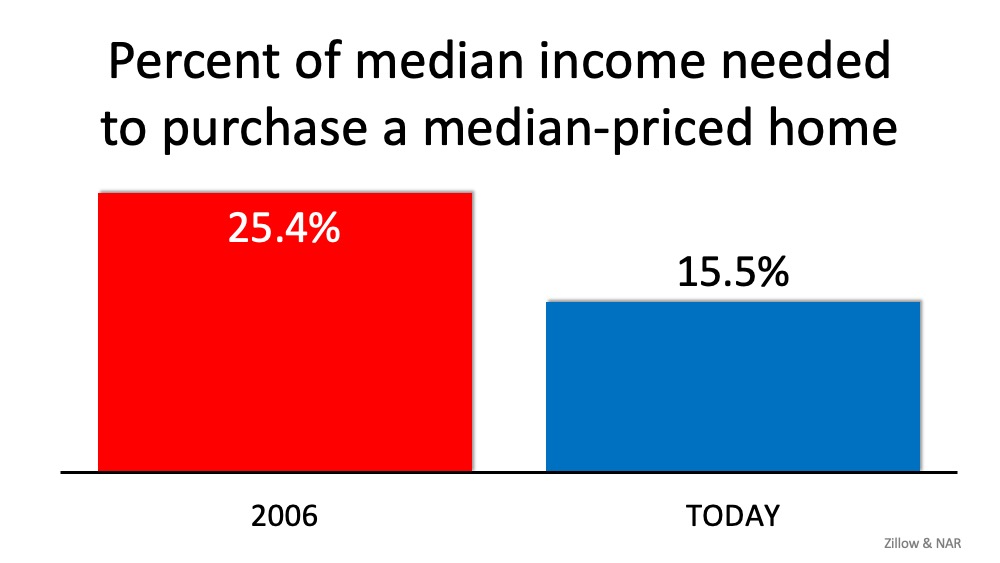
In the run-up to the housing bubble, homeowners were using their homes as a personal ATM machine. Many immediately withdrew their equity once it built up, and they learned their lesson in the process. Prices have risen nicely over the last few years, leading to over fifty percent of homes in the country having greater than 50% equity. But owners have not been tapping into it like the last time. Here is a table comparing the equity withdrawal over the last three years compared to 2005, 2006, and 2007. Homeowners have cashed out over $500 billion dollars less than before: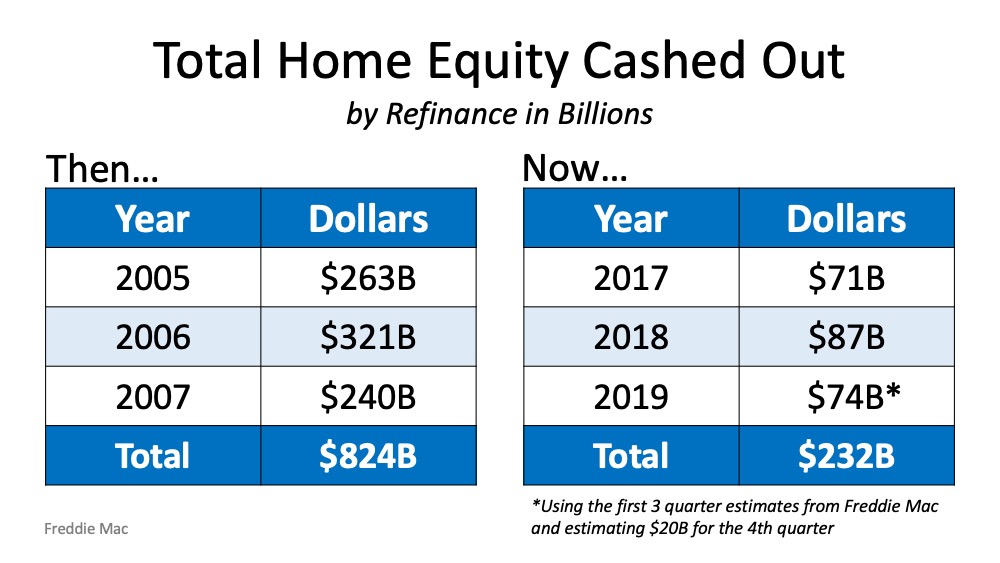 During the crash, home values began to fall, and sellers found themselves in a negative equity situation (where the amount of the mortgage they owned was greater than the value of their home). Some decided to walk away from their homes, and that led to a rash of distressed property listings (foreclosures and short sales), which sold at huge discounts, thus lowering the value of other homes in the area. That can’t happen today.
If you’re concerned we’re making the same mistakes that led to the housing crash, take a look at the charts and graphs above to help alleviate your fears. Or give us a call and ask questions. We are here for you! 870-425-4300

Spring is right around the corner, so flowers are starting to bloom, and many potential homebuyers are getting ready to step into the market. If you’re thinking of buying this season, here’s how mortgage interest rates are working in your favor.
Freddie Mac explains:
“If you’re in the market to buy a home, today’s average mortgage rates are something to celebrate compared to almost any year since 1971…
Mortgage rates change frequently. Over the last 45 years, they have ranged from a high of 18.63% (1981) to a low of 3.31% (2012). While it’s not likely that the average 30-year fixed mortgage rate will return to its record low, the current average rate of 3.45% is pretty close — all to your advantage.”
To put this in perspective, the following chart from the same article shows how average mortgage rates by decade have impacted the approximate monthly payment of a $200,000 home over time: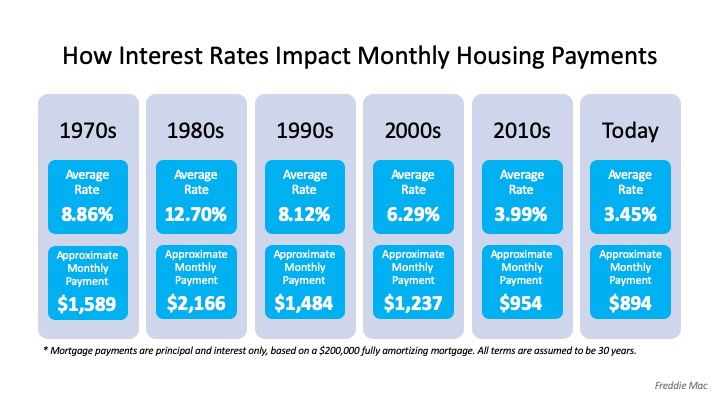 Clearly, when rates are low – like they are today – qualified buyers can benefit significantly over time.
Keep in mind, if interest rates go up, this can push many potential homebuyers out of the market. The National Association of Home Builders (NAHB) notes:
“Prospective home buyers are also adversely affected when interest rates rise. NAHB’s priced-out estimates show that, depending on the starting rate, a quarter-point increase in the rate of 3.75% on a 30-year fixed rate mortgage can price over 1.3 million U.S. households out of the market for the median-priced new home.”
You certainly don’t want to be priced out of the market this year, and waiting may mean a significant change in your potential mortgage payment should rates start to rise. If your financial situation allows, now may be a great time to lock in at a low mortgage rate to benefit greatly over the lifetime of your loan.
